

Summary
Learn the key metrics top-performing sales leaders track to drive results, improve coaching, and boost overall team performance and revenue growth.
Do you know one important factor that separates top-performing leaders from the average ones? Top-performing leaders use data efficiently to make informed decisions.
Top leaders relentlessly use data to make decisions which helps them to win many difficult business situations. They balance their experience with a data-driven point of view. They know that this is the fastest way to growth.
It’s crucial that you always use data to strengthen your point of view and confidently take your decisions/actions.
But, as a sales manager or leader, your problem probably isn’t too little data. It’s too much data. After all, with the latest tools, we can measure everything – and we do. From the percentage of reps using your CRM and cohort retention rate to the average time to hire and sales velocity, there’s a nearly endless list of metrics, reports, and data points.
Let’s be honest: It’s overwhelming. And when you’re overwhelmed, you can’t analyze the data, interpret it, and make a smart decision.
So what’s the solution? Narrowing your focus. Rather than tracking everything, track the most important metrics. Not only will it be easier to understand the trends and their significance, but you can also execute your analysis more quickly.
Now arises another important question. What are those crucial metrics to focus on? Well, the “right” metrics actually depend on your sales organization, industry, and company. However, these 7 metrics tend to be important for the sales leaders across the board.
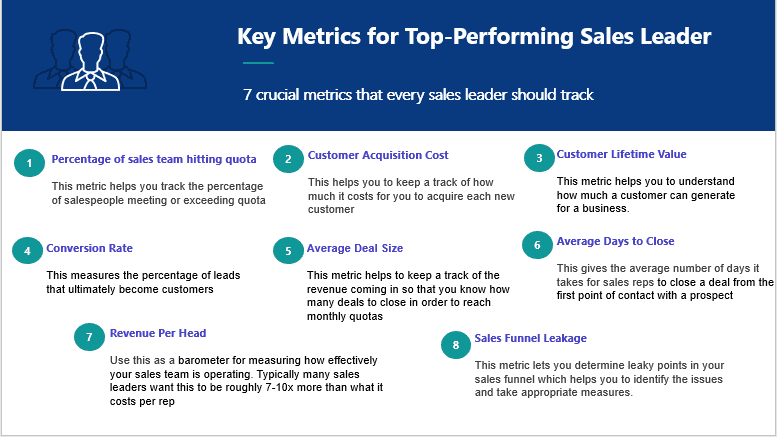
1. Percentage of sales team hitting the quota
Quota attainment, or the percentage of salespeople meeting or exceeding quota, tells you whether your quotas are too high or low. As a rule of thumb, your quotas are likely unrealistic if less than 60% are hitting. It’s also possible that you need to hire better salespeople and/or fire the underperformers. The last potential culprit? Your sales compensation plan. Take a look at your pay structure to see if you’re pulling the right levers to get reps to sell.
On the flip side, if 90% to 100% of your salespeople are hitting quota, then they’re probably coasting. Review your quota-setting methods; you may want to increase your targets.
2. Customer Acquisition Cost
Customer Acquisition Cost commonly referred to as CAC. This represents how much it costs to acquire a new customer. This helps you to ensure new customers are being acquired profitably. It’s also a key metric for boards and investors when evaluating the health of a business. Ultimately, when the CAC is too high, you can explore more efficient ways of acquiring new customers. An example of this may be moving from direct field sellers to inside sales reps.
3. Customer lifetime value
Customer Lifetime Value commonly referred to as LTV. This represents how much a customer spends over the course of their “lifetime”. This metric helps you to understand how much a customer can generate for a business. It is also often looked at in conjunction with Customer Acquisition Cost. Organizations want to have customer LTV be at least 3x what it costs to acquire them. Sales initiatives undertaken are often tied to improving the average LTV of the client base.
4. Conversion Rate
Your conversion rate or win rate measures the percentage of leads that ultimately become customers. If you get approximately 500 leads per month, and on average 50 buy your product, your conversion rate is 10%.
This metric helps you to calculate how many leads you need to make your revenue targets. For example, if your monthly team quota is $800,000, and your average deal size is $1,000, your salespeople need to close 800 deals. And if 10% of your leads become customers, you need 8,000 leads per month.
5. Average Deal Size
Knowing your average deal size will give you a starting point to grow the size of your deals. How can you double your deal size, without knowing your current average deal size, right? So, it’s important that you regularly analyze the size of the deals.
This metric will helps you to keep track of the revenue coming in and will act as a guideline for how many deals need to be closed in order to reach (or surpass) monthly quotas. It can also help you in identifying at-risk opportunities.
Keeping track of this metric month-over-month will also help you to understand how and when your pipeline changes. For example, if the average deal size is increasing, you may be attracting leads with a wider set of needs than in previous months.
6. Average Days to Close
The average number of days to close is based on how long it takes for your sales reps to close a deal from the first point of contact with a prospect.
This metric gives insight into how quickly sales reps are able to move prospects through the pipeline and turn them into revenue for your company.
Various types of prospects require various sale cycle lengths. For example, a larger opportunity may take significantly longer to be closed than one with a smaller value.
7. Revenue per head
The next most important metric is Revenue per Head. Use Revenue per Head as a barometer for measuring how effectively your sales team is operating. Typically many sales leaders want a revenue per head that is roughly 7-10x what it costs per rep. This balances the revenue and cost side of the equation.
8. Sales funnel leakage
Measuring sales funnel leakage tells you where prospects drop out of your funnel at the greatest rates. To determine your leaky points, track stage-by-stage conversion rates. For instance, say 40% of new prospects agree to a discovery call. Half of those make it to the demo stage. Just 5% end up buying. That steep drop-off indicates one of the below reasons.- Your salespeople are likely not qualifying enough,
They might be giving bad demos,
And/or they could be negotiating poorly Knowing these potential issues, you can observe them more closely to determine the true culprit.
Do you know about the top 10 CEOs who started as sales reps?
Top 10 CEOs who started as Sales Reps
Want to learn about sales enablement?
How Sales Enablement can drive revenue growth in 2021?
The Sales Enablement 2021 Yearly Planning Guide
6 Trends that Sales Experts are predicting for 2021
SmartWinnr for Sales Enablement
Automate and gamify your sales enablement activities with the help of SmartWinnr. Our platform helps you to efficiently drive the learning and sales performance of your remote sales employees. You can organize fun and exciting competitions around sales learning and sales activities. And you can also establish live leaderboards to track individual and team level performances.
Interested to see SmartWinnr in action? Book a free demo with us today!